KAIST
BREAKTHROUGHS
Research Webzine of the KAIST College of Engineering since 2014
Spring 2026 Vol. 26Multi-modal medical data analysis for Alzheimer’s disease prediction
Multi-modal medical data analysis for Alzheimer’s disease prediction
The research introduces a framework for multi-modal medical data analysis aiming at predicting Alzheimer’s disease based on graph neural networks (GNNs). Combining image and non-image medical data offers complementary views of the same patient, which eventually leads to more accurate clinical decisions.
Article | Spring 2023
Deep neural networks have been effective in analyzing medical images, but they often overlook the fact that medical data is multi-modal in nature. This means that a patient’s clinical visits produce not only images, but also non-image data containing clinical information, such as demographic features, diagnoses, and lab test results. Combining these different types of data, which offer complementary views of the same patient, can lead to more accurate clinical decisions.
Professor Chanyoung Park’s research team from the Department of Industrial and Systems Engineering at KAIST has developed a framework for multi-modal medical data analysis aiming at predicting Alzheimer’s disease based on graph neural networks (GNNs). This research has been published at AAAI 2023, one of the most prestigious academic conferences in the field of artificial intelligence, which was held from February 7th to 14th, 2023.
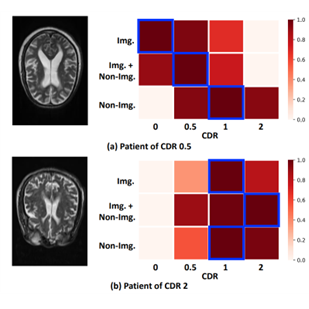
This work focuses on the idea that patients with similar non-image data are likely to suffer from the same disease. For instance, it is well known that people with the E4 allele of apolipoprotein E (APOE) have a primary genetic risk factor for the sporadic form of Alzheimer’s Disease (AD). Hence, by introducing non-image data (e.g., APOE in the tabular data) in addition to image data, preemptive clinical decisions can be made at an early stage of AD, which may not be detected based on image data only (Figure 1).
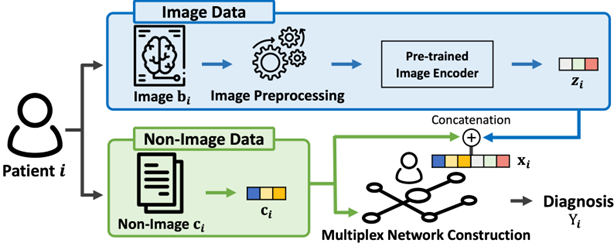
This work proposes a general framework called Heterogeneous Graph Learning for Multi-modal Medical Data Analysis (HetMed) for fusing multi-modal medical data (i.e., image and non-image) based on a graph structure, which provides a natural way of representing patients and their similarities. Each node in a graph denotes a patient associated with multi-modal features including medical images and nonimage data of the patient, and each edge represents the similarity between patients in terms of non-image data. To capture the complex relationship between patients in a systematic way, this work proposes to construct a multiplex network whose edges are connected according to the similarity of various feature combinations, revealing various types of relationships between patients. This approach allows for a more comprehensive and nuanced understanding of patient relationships and can inform clinical decision-making.
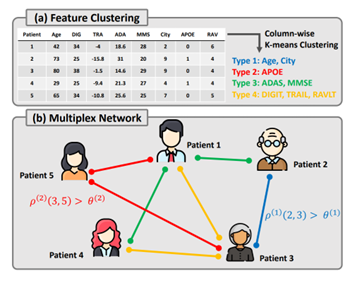
The main challenge of constructing a multiplex network based on patient data is how to extract meaningful relationship between patients as non-image medical data contains various types of information regarding patients, e.g., demographic features, personal and family historical list and lab test results. To automatically categorize various types of non-image features, this work adopts K-means clustering algorithm on the non-image tabular data in a column-wise manner. Lastly, a multiplex network is constructed based on the cosine similarity in terms of each feature type discovered by K-means clustering. This allows for the identification of different types of non-image features and their relationship to the target disease, informing the construction of the multiplex network. The details on how the multiplex network is constructed are described in Figure 2. The overall model framework is shown in Figure 3.
When compared to baseline methods, HetMed performs well, captures important information for clinical decision-making, and demonstrates the effectiveness of fusing multiple modalities. HetMed is also highly explainable and generalizable, making it practical for a wide range of applications.
Most Popular

Lighting the Lunar Night: KAIST Develops First Electrostatic Power Generator for the Moon
Read more
Soft Airless Wheel for A Lunar Exploration Rover Inspired by Origami and Da Vinci Bridge Principles
Read more
Dual-Action Hydrogel Offers New Hope for Rheumatoid Arthritis Treatment
Read more
GPU-NPU-PIM Integration Technology for Generative AI Clouds
Read more
Wearable Haptics of Orthotropic Actuation for 3D Spatial Perception in Low-visibility Environment
Read more