KAIST
BREAKTHROUGHS
Research Webzine of the KAIST College of Engineering since 2014
Fall 2025 Vol. 25Bridging the gap between community detection and graph drawing in social network analysis
Bridging the gap between community detection and graph drawing in social network analysis
KAIST researchers developed a robust community detection algorithm inspired by graph drawing, opening the door toward unifying the two different fields of social network analysis.
Article | Spring 2016
Social network analysis is currently one of the most attractive issues in data mining and machine learning. More people are getting involved in social networks, and these social networks, in turn, become more complicated. The activities of the users on social networking services provide us with important clues to their real-world behaviors and relationships with others. Accordingly, social network analysis has emerged as a key technique in various disciplines including sociology, economics, epidemiology, politics, and psychology.
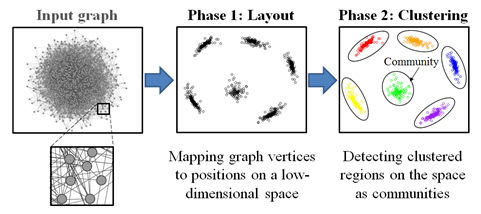
Community detection is a procedure of finding the community structure, with many edges joining vertices of the same community and comparatively few edges joining vertices of different communities. Thus, communities are regarded as groups of users that likely share common properties. Graph drawing is a procedure of deriving a pictorial representation of the vertices and edges of a graph. Several quality measures have been defined for graph drawings in an attempt to find an effective means of evaluating their aesthetics and usability.
Community detection and graph drawing have been parallel universes. Although it looks evident that these two fields have different objectives, they in fact have a great commonality. Graph drawing typically locates adjacent vertices close to each other, to minimize edge crossings and eventually to optimize the aesthetic factor. As a result, a set of densely-connected vertices are gathered together, thereby naturally composing a community in the two-dimensional space.
Motivated by this commonality, Prof. Jae-Gil Lee’s team found that several features inherent in graph drawing can advance community detection, and developed a novel community detection algorithm, called BlackHole, for undirected graphs by importing a geometric embedding technique from graph drawing. In BlackHole, unlike conventional graph drawing, the attractive force between vertices increases exponentially as the distance between them decreases. As a result, the vertices possibly belonging to the same community collapse into a single position on a drawing space just like a black hole, which is why the algorithm was named BlackHole.
BlackHole outperforms the state-of-the-art algorithms, especially when the community structure is not easily detectable, by virtue of this unique design of the attractive force. Experiment results are given below, where µ is the complexity of the community structure. This work will be published at the IEEE ICDE 2016 conference, which is a premiere conference on data engineering [1].
Most Popular

Wearable Haptics of Orthotropic Actuation for 3D Spatial Perception in Low-visibility Environment
Read more
How AI Thinks: Understanding Visual Concept Formations in Deep Learning Models
Read more
TwinSpin: A Novel VR Controller Enabling In-Hand Rotation
Read more
Soft Airless Wheel for A Lunar Exploration Rover Inspired by Origami and Da Vinci Bridge Principles
Read more
Title WSF1 Vision Concept: Redefining Wearable Robotics through Human-centred Mobility Design
Read more
![[1] Lim, S., Kim, J., and Lee, J., "BlackHole: Robust Community Detection Inspired by Graph Drawing," In Proc. 32nd Int'l Conf. on Data Engineering (IEEE ICDE), Helsinki, Finland, to appear.](http://breakthroughs.kaist.ac.kr/wp/wp-content/uploads/2016/02/12-1.jpg)
