KAIST
BREAKTHROUGHS
Research Webzine of the KAIST College of Engineering since 2014
Spring 2025 Vol. 24Project Black Box: Learning and predicting the economy from satellite imagery
Project Black Box: Learning and predicting the economy from satellite imagery
High-resolution daytime satellite imagery contains rich and sophisticated geospatial information of faraway regions. This highlight introduces remarkable projects led by an interdisciplinary team of researchers from computer science, economics, and geography, developing deep learning models to quantify fine-grained economic activities from satellite imagery. This novel approach can positively impact the developing world and augment the existing survey-based measurements, which are costly.
Article | Special Issue
Collecting data on socioeconomic activities is critical for designing policies to promote and sustain economic development. Every developed country deploys significant amounts of financial and human resources to conduct censuses and surveys. However, the same kind of rich information is not accessible to developing or underdeveloped countries that lack resources to conduct expensive surveys and suffer from data reliability issues. In solving complex and grand societal problems like this, big data and machine learning can be useful.
The Data Science Group led by Prof. Meeyoung Cha in the KAIST School of Computing has developed a new method to overcome these limitations in economic measurements by utilizing the view from above, i.e., high-resolution satellite imagery. The research group takes a highly interdisciplinary approach by collaborating with economists and geographers, including Prof. Jihee Kim in the School of Business and Technology Management at KAIST, Prof. Sangyoon Park at the University of Hong Kong, and Prof. Hyunjoo Yang at Sogang University. This multidisciplinary research team has succeeded in teaching machines to quantify economic activities from satellite images accurately.
The team has proposed two deep learning models: the first model predicts economic indicators from a satellite image by resolving the data representation mismatch. The second model learns to score the economic development level of a satellite image even without ground-truth data.
While economic data is usually available by administrative units, satellite images are stored over grids (Fig. 1). This mismatch in representation makes existing models not readily applicable to satellite images as ground-truth. The proposed model overcomes this mismatch by efficiently extracting key fixed-length features from any number of satellite images. The team has demonstrated how well the model separates grid images by embedding the data and performing dimensionality reduction.
Images from urban and rural regions were well separated into different embedding spaces (Fig. 2). This proposed lightweight model outperformed the state-of-the-art approach, yielding a high R-squared value of 0.9617 in predicting the population density of South Korea. The model is also robust to the original labels’ size, showing its general applicability for various economic measures such as population density, age, education, and income. This work, titled “Lightweight and Robust Representation of Economic Scales from Satellite Imagery,” was presented at the 34th AAAI Conference on Artificial Intelligence (AAAI-20) (DOI: 10.1609/aaai.v34i01.5379).
In the subsequent research, the team has focused on the challenge of a limited dataset; while deep learning models typically require a massive amount of ground truth data for training, this is not available in the domain of human geography and high-resolution satellite image research. To overcome this challenge, the team has proposed a new rank-based scoring algorithm that operates in the absence of ground-truth statistics. The proposed model breaks down the problem into sub-tasks and utilizes a human-in-the-loop solution for better prediction (Fig. 3).
When evaluated with South Korean data, the model successfully estimates the population density with a Spearman correlation of 0.795. The model outperformed nightlight-based predictions, a previously-available proxy for developing countries’ economic development that has been tested for Vietnam and Malawi (Fig. 4). This model has substantial policy implications, particularly for countries with poor infrastructure, where collecting high-quality socioeconomic data is extremely costly and challenging. This research, titled “Learning to Score Economic Development from Satellite Imagery,” was presented at the 26th ACM SIGKDD Conference on Knowledge Discovery and Data Mining (KDD-20) (DOI: 10.1145/3394486.3403347).
The team will continue to pursue AI-centered research that has a broad social impact. Prof. Cha said, “We hope our models can bring useful data insights to the developing world. We also wish to understand better the economic situations of restricted regions like North Korea.” The team has made the implementation codes and research outcomes publicly available at https://github.com/dscig/urban_score.
Reference
https://doi.org/10.1609/aaai.v34i01.5379
Han et al. “Lightweight and Robust Representation of Economic Scales from Satellite Imagery.” In Proc. of the AAAI Conference on Artificial Intelligence, 2020.
https://doi.org/10.1145/3394486.3403347
Han et al. “Learning to Score Economic Development from Satellite Imagery.” In Proc. of the 26th ACM SIGKDD International Conference on Knowledge Discovery and Data Mining, 2020.


Most Popular

When and why do graph neural networks become powerful?
Read more
Smart Warnings: LLM-enabled personalized driver assistance
Read more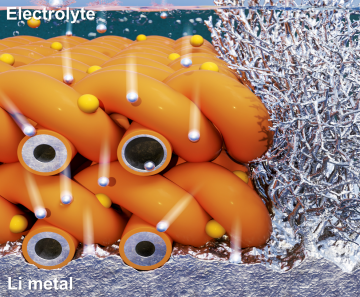
Extending the lifespan of next-generation lithium metal batteries with water
Read more
Professor Ki-Uk Kyung’s research team develops soft shape-morphing actuator capable of rapid 3D transformations
Read more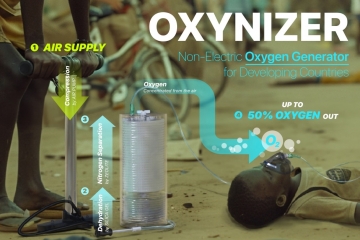
Oxynizer: Non-electric oxygen generator for developing countries
Read more