KAIST
BREAKTHROUGHS
Research Webzine of the KAIST College of Engineering since 2014
Spring 2025 Vol. 24Stealth performance evaluation technology: scanning free space measurement system
Stealth performance evaluation technology: scanning free space measurement system
A key technology that evaluates the stealth performance of a whole specimen automatically was developed through a scanning free space measurement system (SFSM system). This system combines a free space measurement system (FSM system) with focused horn antennas and a two-axis linear stage that enables the automatized measurement of the whole specimen. Major aerospace industries are expected to adopt the proposed system from 2019
Article | Fall 2018
Stealth technology is a technique that can minimize detection by radar systems. Fighters and battleships without stealth are easily detected by the enemy, while those with stealth can perform missions without being exposed to the enemy. Radar absorbing structure (RAS) is a part of the stealth technology that absorbs electromagnetic (EM) waves and minimizes radar detection in a specific frequency band. To develop the RAS, many researchers have used measurement system to evaluate stealth performance.
A research team by Prof. Jung-Ryul Lee in the Dept. of Aerospace Engineering at KAIST has demonstrated stealth performance evaluation technology called the free space measurement system (FSM system). This system measures the return loss (S11) and insertion loss (S21) using focused horn antennas and evaluates the stealth performance of the RAS. However, in the FSM system, the evaluation of stealth performance at the RAS is based on the measurement result of a single point. There is a limitation for evaluating the stealth performance of the whole specimen.
A research team by Prof. Jung-Ryul Lee developed a new system for evaluating the stealth performance of the whole specimen, which is a scanning free space measurement system (SFSM system). The two-axis linear stage with the sample holder was located between two focused horn antennas for automatic raster scanning of the specimen and a personal computer for hosting the graphical user interface (GUI) software that can automatically measure and evaluate the stealth performance. At each point, the measured data was shown at the applied frequency range. Inside the scan area, it was possible to visualize the measured results at each frame divided into sweep points and to analyze the visualization results in the whole frequency range through the video file. This system achieved high accuracy and reliability for the standard specimen. The system could be applied for complex stealth structures with thickness and material variations, as well as for detecting manufacturing defects, i.e. differences from design. In the future, major aerospace industries are expected to adopt the proposed system.


Figure 1 shows the SFSM system and specification. Figure 2 depicts the SFSM system mechanism in 3D array data structure and visualization result at each frame. Figure 3 shows the full-field distribution of the stealth performance at RAS specimen with aluminum. In Figure 3, the RAS specimen was located at the center of a piece of aluminum. The scan area was 750 × 600 mm to include the specimen, sample holder, and air. The scanning interval was set to 10 mm, with the overlapped area of the focused horn antenna spot size being about 80%. Distinct differences in return loss between the RAS and aluminum, and between the aluminum and air, could be visualized along each boundary. In air, the return loss was more than -30 dB, and the color scale was blue because most EM waves were transmitted through the air. On the other hand, in aluminum, the return loss was almost 0 dB, and the color scale was red because all EM waves were reflected by the aluminum. In the case of RAS, it could be seen that the return loss increased in negative value as the frequency increased because the absorption of EM waves increased in RAS specimen.
Most Popular

When and why do graph neural networks become powerful?
Read more
Smart Warnings: LLM-enabled personalized driver assistance
Read more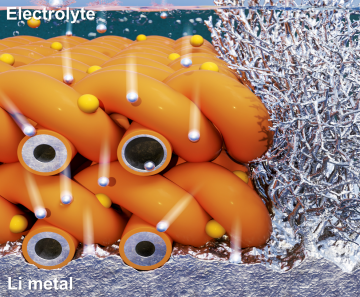
Extending the lifespan of next-generation lithium metal batteries with water
Read more
Professor Ki-Uk Kyung’s research team develops soft shape-morphing actuator capable of rapid 3D transformations
Read more
Oxynizer: Non-electric oxygen generator for developing countries
Read more